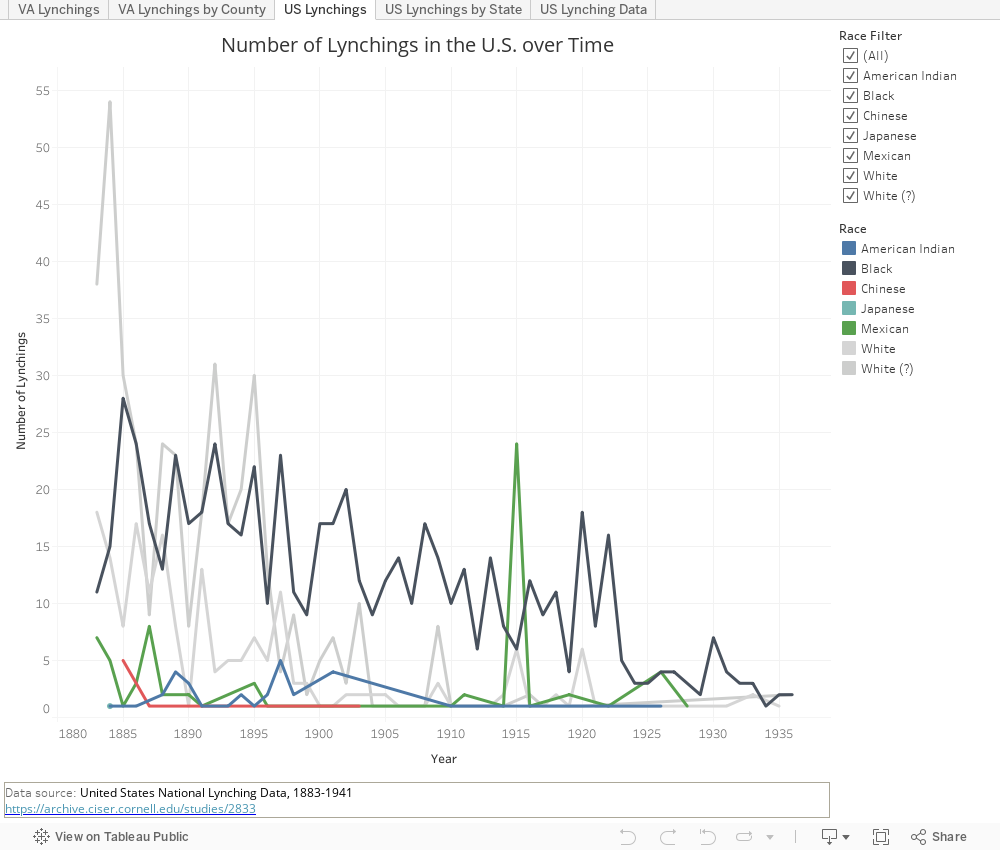
The data set for these visualizations is the United States National Lynching Data, 1883-1941. On the first set of visualizations (at the top of the page), you can select one of the tabs to view the a different visualization. You can also use the filter elements at the right to focus your inquiry.
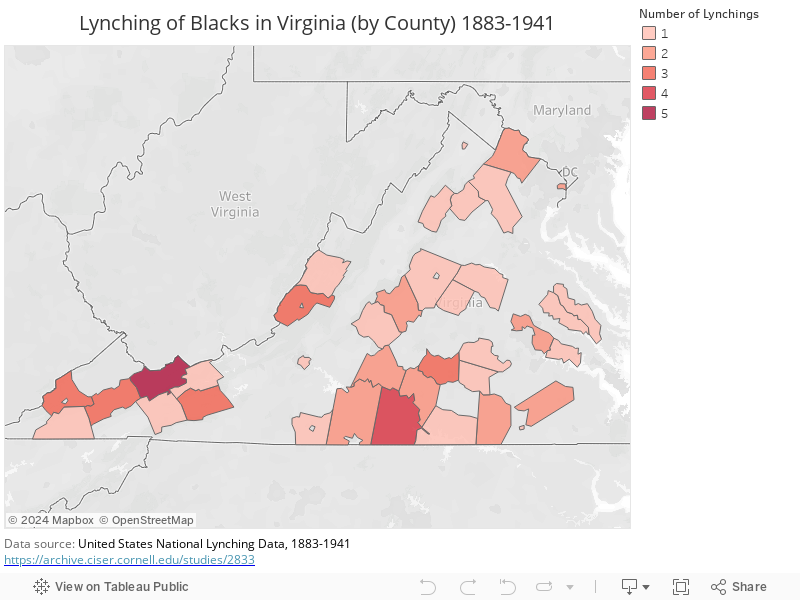
The visualization at bottom is a chloropleth map that displays a representation of the lynching of Blacks in Virginia.
![]()
![]()
![]()